This report will contain an overview of all risk actions that are overdue or scheduled. This report will show graphs and a progress table of all risk actions, linked to the Business Unit.
|
FILTERS |
|
|
Filter |
Description |
|
Risk Type |
Dropdown allows users to choose the type of risk (Default to 'Show All'). |
|
Directorate |
Dropdown allows users to choose the Directorate (Default to 'Show All'). |
|
Business Unit |
Dropdown allows users to choose the Business Unit (Default to 'Show All'). |
|
Risk Category |
Dropdown allows selection of a Risk Category (defined in Risk Settings > Categories). 'Show All' is selected by default. |
|
Risk Responsible Person |
Dropdown allows selection of a Staff member (defined in Framework > Staff) to filter by risk responsible officer. 'Show All' is selected by default. |
|
Risk Status |
Dropdown allows the users to choose the status of the Risk (Default is set to 'Active'). |
|
Date Section (TO and FROM) |
This will allow user to input the start and end date of the risk solutions. |
|
Risk Rating Initial |
Dropdown allows selection of a Risk Rating for the Initial phase of the risk assessment (defined in Risk Settings > Risk Ratings). 'Show All' is selected by default. |
|
Risk Rating Current |
Dropdown allows selection of a Risk Rating for the Current phase of the risk assessment (defined in Risk Settings > Risk Ratings). 'Show All' is selected by default. |
|
Risk Rating Future |
Dropdown allows selection of a Risk Rating for the Future phase of the risk assessment (defined in Risk Settings > Risk Ratings). 'Show All' is selected by default. |
|
Risk Action Status |
Dropdown allows selection of the risk action status (Completed, Overdue or in progress). |
|
Show Risk Actions Overview |
Tick box will allows you to show or hide the ‘Risk Actions Overview’ section of the report. Default will be to show the section (Ticked). If you were to untick this, then it will hide from the report. |
|
Show Risk Action Summary Chart |
Tick box will allows you to show or hide the ‘Risk Action Summary Chart’ section of the report. Default will be to show the section (Ticked). If you were to untick this, then it will hide from the report. |
|
Show Filter Page |
Tick box will allows you to show or hide the filter page in the report. Default will be to show the section (Ticked). If you were to untick this, then it will hide from the report |
|
Show Risk Action Summary |
Tick box will allows you to show or hide the ‘Risk Action Summary’ section of the report. Default will be to show the section (Ticked). If you were to untick this, then it will hide from the report. |
|
REPORT DETAILS |
|
|
Report Element |
Description |
|
Cover Page |
Cover Page which will show the report name and client logo |
|
Report Filter Page |
Report filter page displaying all the filter selections made to run the report. You can hide this section from the report via the filters. |
|
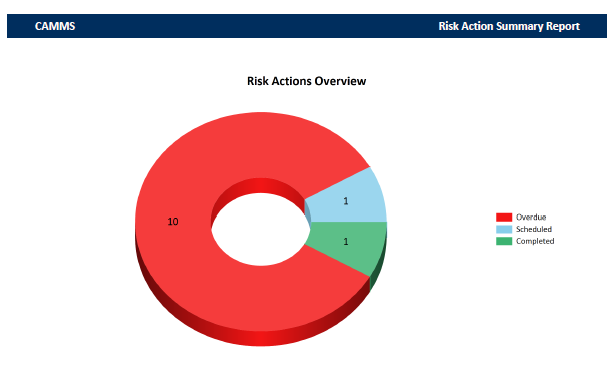
Risk Actions Overview donut graph |
Displaying the total list of Risk actions in graph form – Only the risk actions which are overdue or scheduled within the dates selected from the filters (Date TO and FROM). |
|
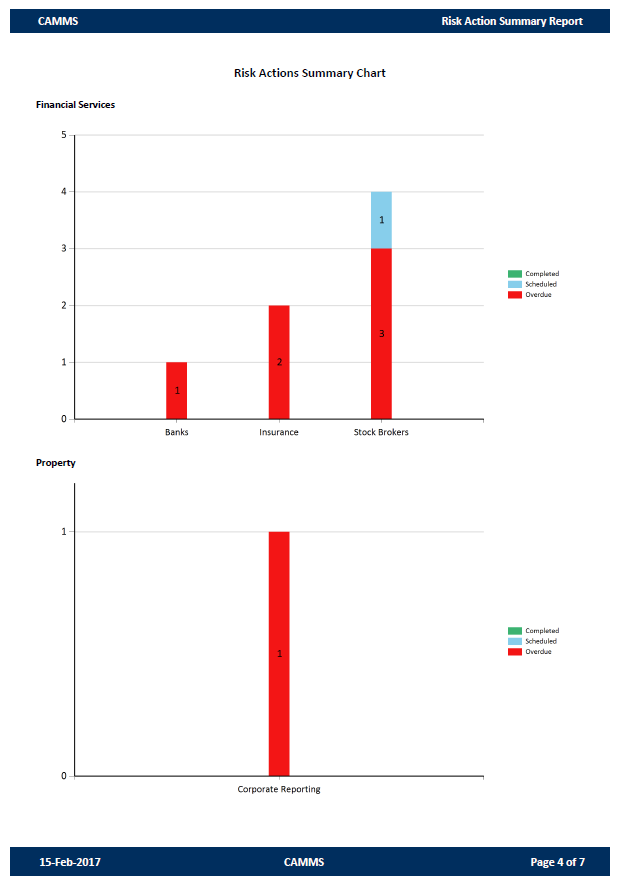
Risk Actions Summary Graph |
A graph for every Directorate, it will display the risk action statuses by Business Unit. |
|
Risk Actions Summary |
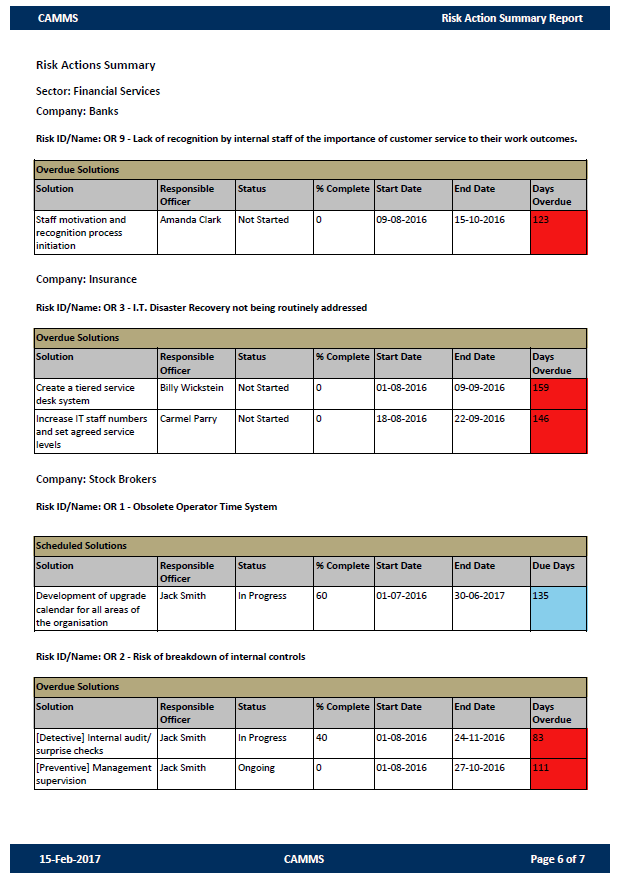
This section will display all risk actions grouped by Directorate, Business Unit and Risk. The risk actions are further grouped by if they are Overdue (end date has passed and it is not yet completed), or scheduled to be completed (end date is within the date FROM and TO filter). |
|
Directorate |
Directorate which the Business Unit is linked to. |
|
Business Unit |
The Business Unit which the risk is linked to. |
|
Risk Action Details |
|
|
Risk ID / Name |
Risk Code and Risk Title which the risk actions are linked to. |
|
Solutions/ Risk Action |
Risk action title |
|
Responsible Person |
Risk Action Responsible person |
|
Status |
Risk Action current status |
|
% Complete |
Risk Action current % complete |
|
Start Date |
Risk Action Start Date |
|
End Date |
Risk Action End Date. |
|
Due Days |
Overdue Risk Actions – the number of days it has been overdue for (YTD) – Flagged red.
Scheduled Risk Actions –How many days until the risk action is due to be completed (YTD) – Flagged Blue.
Note: All of these risk actions showing are based around their start and end dates. The risk actions start and end dates must be within the date section filter that you have selected when running this report. |
Report example output:


Copyright © 2014-2015 CAMMS Online Help. All rights reserved.
Last revised: September 23, 2018